Cattle Market Outlook
thumbnail
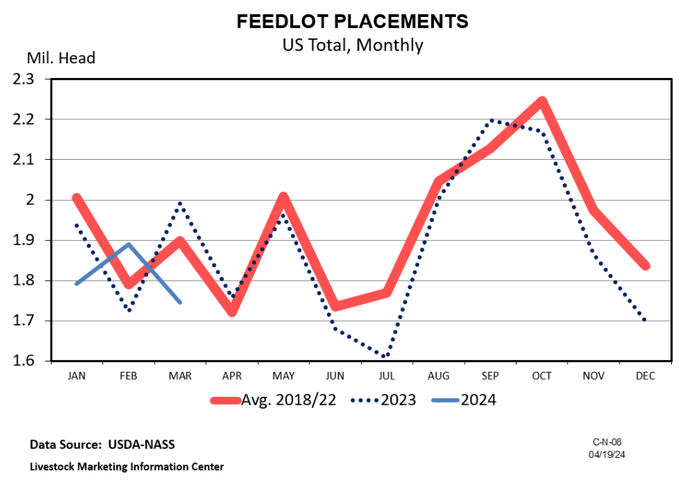
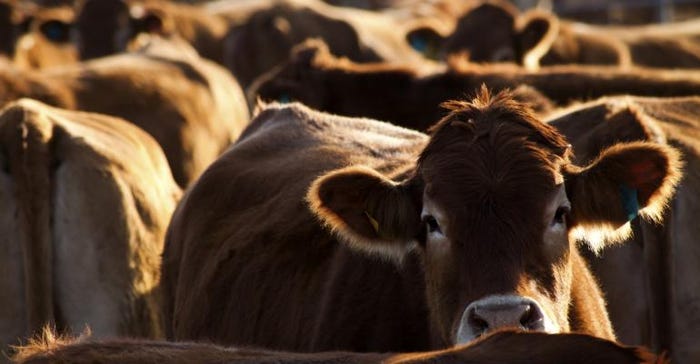
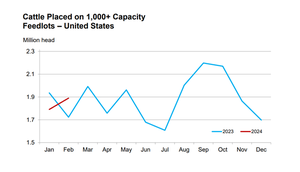
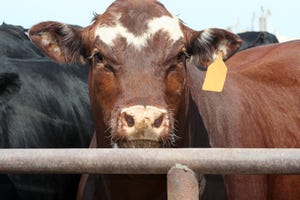
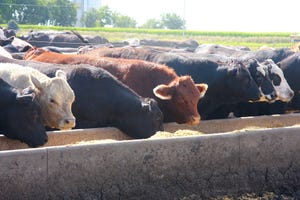
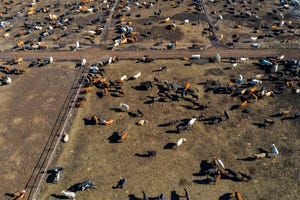
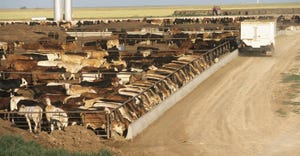
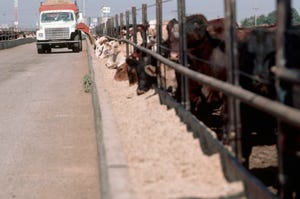
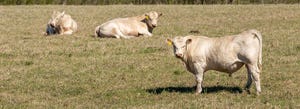
Market newsU.S. beef, cattle demand posts early 2024 highsU.S. beef, cattle demand posts early 2024 highs
Trade deficit continues to widen as beef production declines.

byAnn Hess
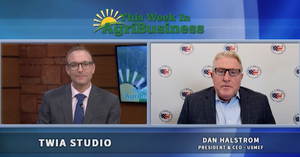


Recent Headlines


Enter a zip code to see the weather conditions for a different location.

Aug 27 - Aug 29, 2024
Aug 27 - Aug 29, 2024
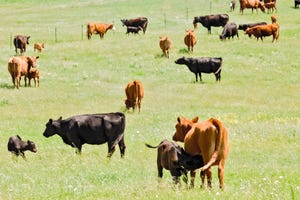
Farm Progress Show annually hosts more than 600 exhibitors displaying new farm equipment, tractors, combines and farm implements; seed and crop protection products; and many additional farm supplies and services.
LEARN MORESubscribe to Our Newsletters
BEEF Magazine is the source for beef production, management and market news.