Is agriculture the bad boy in the nation’s water use?
Who uses all that water?
June 8, 2015

As the drought in California and Nevada continues unabated, attention on water use in the general media is heating up as well. And, on occasion, that attention blames agriculture for wasting precious water resources.
So which industries use the most water? While data can be incomplete and sometimes a little dated, here’s a rundown on major water uses in America.
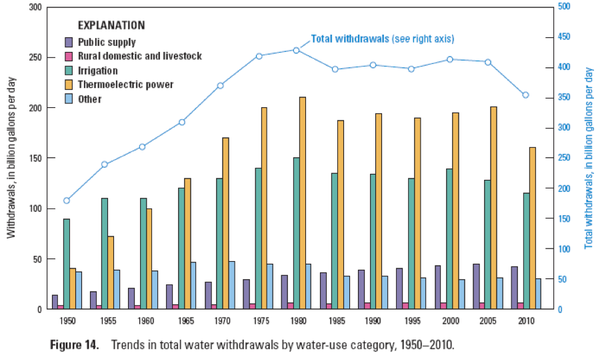
Americans used 355 billion gallons of water per day for all uses in 2010, according to the “Estimated Use of Water in the U.S. 2010” circular from the U.S. Geological Survey (USGS).
That was 13% less than in 2005 and the least since 1970.
Of those 355 billion gallons per day, freshwater withdrawals were 306 billion gallons per day, or 86% of the total. Of total freshwater withdrawals, 75% was from surface water (230 billion gallons per day) and 25% from groundwater (76 billion gallons per day).
The Estimated Use of Water circular is the 13th in an ongoing USGS series published every five years since 1950—the longest compilation record of water use data by a federal agency in the U.S. It’s also one of the few sources of information about regional and national trends in water withdrawals.
According to the report, thermoelectric power and irrigation remained the two largest water users in 2010. And that puts agriculture squarely in the crosshairs as the national debate over water use heats up. Here’s a look at the industries that are the major water users in the U.S.:
Thermoelectric power uses 161 billion gallons per day
Thermoelectric power accounted for 161 billion gallons per day in 2010—99% of it from surface water; 73% of that freshwater. It amounted to 45% of total water withdrawals for all uses; 38% of freshwater withdrawals for all uses. Withdrawals for thermoelectric power were 20% less than in 2005.
That 161 billion gallons of water used for thermoelectric power accounted for 45% of total water withdrawals, but was about 20% less than in 2005. Reasons for the decline include thermoelectric plant closures, decreased use of coal (more natural gas) and more efficient cooling technology.
Irrigation accounts for 115 billions gallons per day
Irrigation accounted for 115 billion gallons per day in 2010 or 129,000 acre feet per year, the lowest level since before 1965. Keep in mind, this was in 2010, at the headwaters of the massive drought that continues to hamstring large pockets of the nation.
Of total freshwater withdrawals, irrigation accounts for 65%, primarily in California, Arkansas, Texas and Nebraska. Cumulatively, these four states account for 42% of total national groundwater withdrawals for irrigation. Nearly all groundwater withdrawals for irrigation (96%) are freshwater.
Irrigation accounted for 38% of total freshwater withdrawals or 61% of total freshwater withdrawals, excluding those for thermoelectric power.
Of irrigation withdrawals, 65.9 billion gallons per day were from surface water, accounting for 57% of irrigation withdrawals. That was almost 12% less than in 2005. Reasons cited for declining use was more water-efficient irrigation—more sprinklers and less flood irrigation.
Groundwater withdrawals for irrigation were 49.5 billion gallons per day, which was 6% less than in 2005. About 62.4 million acres were irrigated in 2010—950,000 acres more (1.5%) than in 2005.
Mining withdrawals make up 1% of total withdrawals
Mining withdrawals were about 1% of total withdrawals, but were 3% of all withdrawals excluding thermoelectric power.
Groundwater was the source of 73% of the mining withdrawals (71% of that saline); 80% of the surface water used by mining was freshwater.
Total mining withdrawals in 2010 were 39% more than in 2005. Groundwater withdrawals were 54% more than in 2005; surface water withdrawals were 9% more.
Public water supply use is 42 billions gallons per day
Public water supply withdrawals in 2010 of 42 billion gallons per day were 5% less than in 2005 and represented the first decline in public withdrawals since the five-year reporting began in 1950.
Public supply withdrawals in 2010 accounted for 14% of total freshwater withdrawals for all uses and 22% of the withdrawals excluding thermoelectric power. In 2010, 268 million of the U.S. population (approx. 86%) received potable water from the public supply—unchanged since 2005.
An estimated 44.5 million people in the U.S. provided their own water for domestic use in 2010, about 1% of total withdrawals for all uses in 2010—98% of that 1% was freshwater.

Source: U.S. Geological Survey
You might also like:
5 essential steps for fly control on cattle
60+ stunning photos that showcase ranch work ethics
7 tools to win the war against cattle flies
7 U.S. cattle operations honored for stewardship efforts
About the Author(s)
You May Also Like


.png?width=300&auto=webp&quality=80&disable=upscale)
