Subscribe to Our Newsletters
BEEF Magazine is the source for beef production, management and market news.
The USDA crop progress update on Monday showed further deterioration in crop conditions, although it did not match some of the more dismal analyst estimates.
July 10, 2012

There is plenty of anticipation ahead of USDA’s latest World Agricultural Supply and Demand Estimates (WASDE) report as trade continues to debate the potential impact of drought conditions on the current corn crop. The USDA crop progress update on Monday showed further deterioration in crop conditions, although it did not match some of the more dismal analyst estimates.
As of July 8, USDA says just 40% of the corn crop was in Good/Excellent (G/E) condition. This compares to G/E ratings of about 69% for last year and the five-year average. Particularly troubling was the sharp drop in crop conditions in Iowa, with the latest reading indicating 46% of the crop there in G/E condition. Last week, USDA had Iowa G/E rating at 62%.
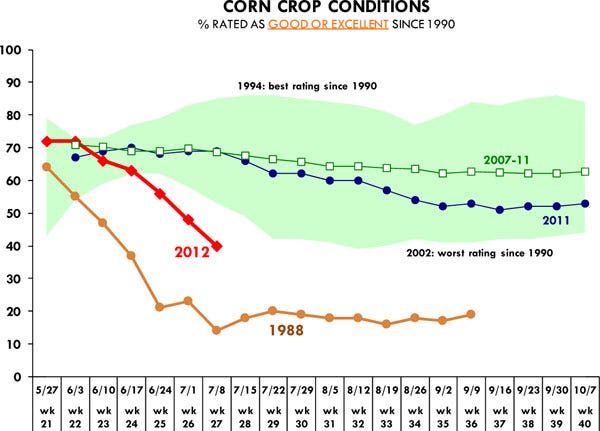
Comparisons are being made to the disastrous impact of the 1988 drought. The crop ratings from that year are depicted in the accompanying table. While we are still well above the conditions in that drought year, keep in mind that there are critical differences between this year’s crop and that in 1988.
By the end of the first week in July, USDA reported that about 50% of the 2012 corn crop was in the silking stage (first kernel growth stage). During the same week in 1988, just 19% of the crop was silking.
It’s critical that the current crop receives some moisture in the next 10-14 days. Already there are numerous reports, especially from the eastern Corn Belt, of crop failures and farmers deciding to run a bush hog through dead plants and maybe try for a late planted bean crop (hard to do given current dry conditions and lack of subsoil moisture).
It will be interesting to see how USDA adjusts its supply/demand table for corn with this background of dismal drought conditions and memories of 1988. The planted acres will reflect the results of the acreage survey at 96.405 million acres. The harvested acres from that survey were estimated at 88.851 acres but that did not capture what has happened in the last four weeks and it is possible the harvested number may be lowered.
In 1988, the ratio of harvested to planted acres was 86% vs. the 92% in the June 2012 acreage survey. A one-point drop in the ratio implies a loss of about 1 million acres.
The July USDA estimate doesn’t rely on objective yield data because there’s nothing to be objectively tested. The estimates reflect trends but also the assessment of USDA analysts based on field reports and crop progress data. Analysts polled ahead of the report (to be released at 8:30 am EST on Wednesday morning) indicated they expect USDA to show ending stocks for 2012/13 at around 1.2 billion bu. This is about 600 million bu. less than what USDA published in June but it may not reflect private estimates of even larger yield losses.
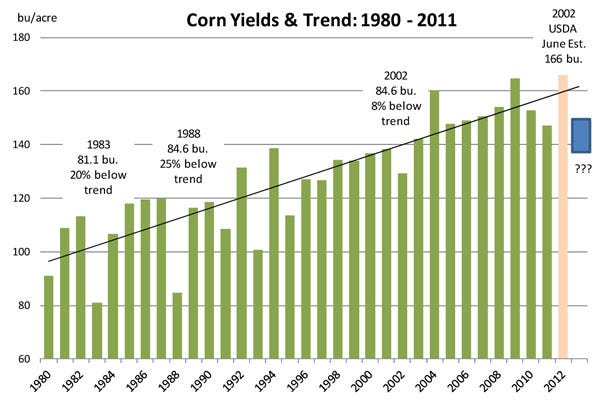
Ending stocks of 1.2 billion bu. are probably based on yields of around 158 bu./acre (with only small demand changes). This is because trade thinks USDA will likely be reluctant to make bigger revisions until August yield data starts to come in. But memories of 1988 persist, a year when actual yields declined 25% from trend. Even a 12% decline from trend would push yields below 140 bu./acre and require dramatic feed use rationing.
You May Also Like
Enter a zip code to see the weather conditions for a different location.