Benchmarking is the management process of comparing your herd’s production and economic numbers to the average of a set of benchmark herds to identify your herd’s strengths and weaknesses. Benchmarking helps direct your management efforts toward critical production and economic factors.
First, identify your herd’s strengths — that is, where your herd beats the benchmark averages. Pat yourself on the back and say “well done.” Capitalize on your herd’s strengths. I have never found a herd that did not have some production strengths that could be capitalized on.
Second, identify your herd’s weaknesses — that is, where the benchmark averages beat your herd’s numbers. Examine your herd’s weaknesses one by one to see if you can do something to improve. As you remove weaknesses from your herd, herd profit tends to go up.
Depending on your situation, it may take a whole year to remove or change one major weakness, but benchmarking should help you focus your limited management time. Your next year’s benchmarks will help you measure your progress.
| Download these charts in .PDF format. |
The problem with benchmarking is that you need some benchmarks to compare to. The two major sets of benchmarks available are Standardized Performance Analysis (SPA) benchmarks from Texas A&M University, covering Texas, Oklahoma and New Mexico. The second is Finpack (farm financial planning and analysis software) benchmarks called Finbin from the University of Minnesota covering several Northern, Midwest, and Western states. Both sets of benchmarks are available through a Google search. North Dakota’s Farm Business Management (ND-FBM) benchmarks presented here are part of Finpack’s expanded multistate set of benchmarks.
Herd performance benchmarks
I like to start a herd’s benchmarking analysis with herd performance data like those listed in Figure 1. For example, weaning percentage is based on the number of live calves born per total females exposed in last year’s breeding season (not this past breeding season). Agricultural financial guidelines are also available under the title “Farm Financial Guidelines” published by the Farm Financial Standard Council, also available with a Google search.
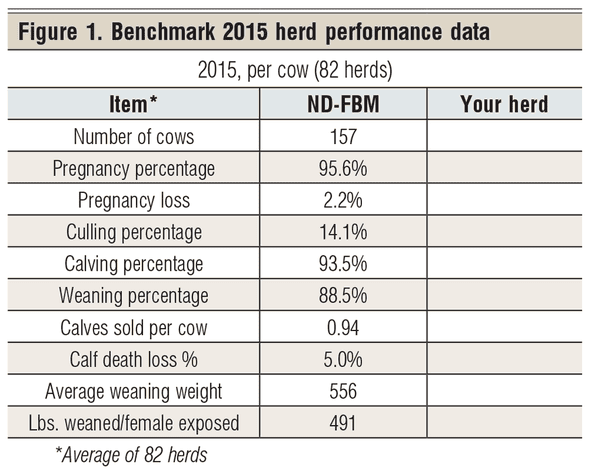
This year’s (2015) 82 Northern Plains beef cow herds averaged 157 cows per herd, of which 93.5% of the bred females calved. Five percent of live calves that were born died, giving a final weaned percentage of 88.5%. A “Your herd” column is presented so that you can benchmark your herd in Figure 1. Did your herd beat these benchmarks or did the benchmarks beat you?
The average weaning weight was 556 pounds for both the steer and heifer calves. This generated a “lbs. weaned/female exposed” of 491 pounds This is one of the more important benchmarks that I look at. It tells a lot about the overall performance of the herd.
Several critical production factors enter into the “lbs. weaned/female exposed.” If this benchmark number is high for your herd, you move on. If this number is low, you need to dig deeper into the production numbers below this number.
For example, areas such as pregnancy rate, calf death loss, pregnancy loss, low weaning weights and low weaning percentages can be the production problem or problems. Calving distribution can also impact “lbs. weaned/female exposed.”
North Dakota’s CHAPS (Cow Herd Appraisal Performance System) provides additional production benchmarks, including calving distribution. A Google search for “CHAPS 2000 benchmark numbers” should find them.
Gross income benchmarks
ND-FBM approaches gross income with a “gross margin,” as in the top section of Figure 2. It calculates calf sales and cull animal sales plus beef calves transferred out, and adjusts that total by subtracting animals purchased into the herd (like bull purchases and purchased replacement heifers), animals transferred in (like raised replacement heifers) plus herd inventory change to arrive at a total “gross margin.” In this case, the benchmark gross margin equals $895 per cow.
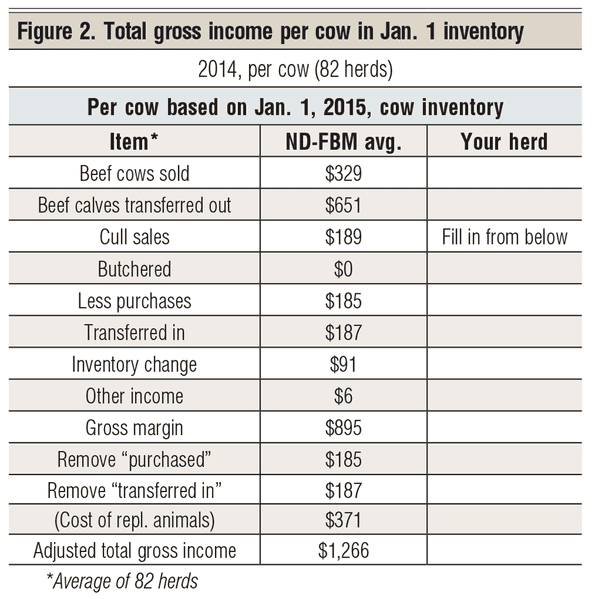
I like to take out the “purchased” and “transferred in” and treat them as part of the production costs. So by adding these two items back in, I get an “adjusted total gross income” of $1,266 per cow (see bottom of Figure 2). The net income bottom line is the same for both income procedures. I just prefer the latter system of accounting.
Economic summary
Figure 3 presents the economic benchmarks for these Northern Plains herds. The first economic benchmark I like to focus on is the “feed cost per cow,” which is benchmarked at $361 per cow. This is both the summer grazing cost and winter feed bill.
Your situation will vary considerably on winter and summer feed costs, depending on where you live, but your total annual feed cost may well not vary much from this annual figure. How is your herd on this benchmark? Did you beat the benchmark or did the benchmark beat you?
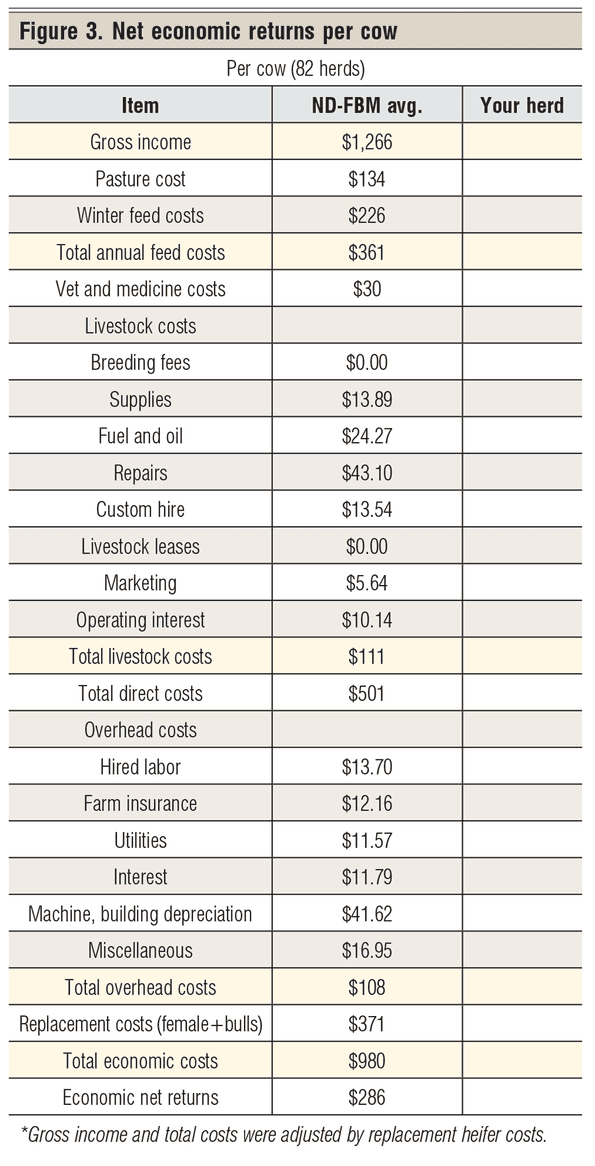
The vet and medicine benchmark is $30 per cow. Total livestock fees consist of livestock supplies, livestock fuel and oil, livestock repairs, custom hire, livestock leases, marketing, and operating interest (beef cow herd proportion). The benchmark for this total is $111 per cow.
Total direct costs include feed costs ($361) and livestock costs ($111), for a total cost of $501 per cow. Overhead costs consist of hired labor, farm insurance, utilities, interest, machinery and building depreciation, and miscellaneous costs, for a total overhead cost of $108 per cow. Replacement heifer costs and replacement bulls totaled $371 per cow (record high). Add all of these benchmark costs together and the benchmarked total economic cost is $980 per cow.
Benchmark gross income per cow is $1,266 and the total economic cost is $980, giving a benchmark “net economic return” of $286 per cow in the Jan. 1, 2015 inventory.
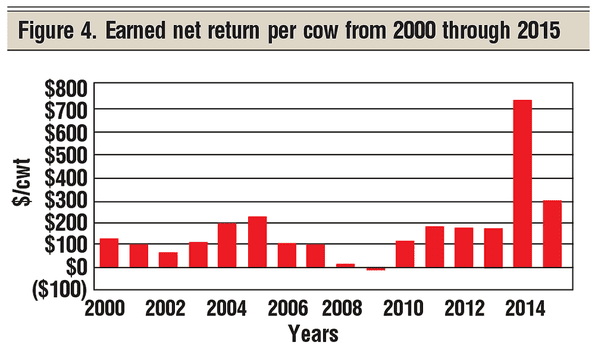
One question I am often asked when benchmarking a given herd’s economic performance is, how does this compare to other years? Figure 4 addresses this question. Figure 4 is a chart of the average earned net income per cow for Northern Plains beef cow herds for the last 16 years. We will never forget that 2014 and 2015 had the second-highest earned net returns per cow ever recorded.
Harlan Hughes is a North Dakota State University professor emeritus. He lives in Kuna, Idaho. Reach him at 701-238-9607 or [email protected].
You might also like:
9 new pickups for the ranch in 2016
Use cow-pie-ology to monitor your herds nutritional status
70 photos of hardworking beef producers
5 must-do steps for fly control on cattle
Photo Tour: World's largest vertically integrated cattle operation
When is the best time to wean? It might be younger than you think
You won't believe this is the least expensive way to breed cows
About the Author(s)
You May Also Like


